West Virginia's schools are losing students. The reasons reach far beyond school choice.
A shrinking child population and changing education choices help explain a decline that began long before Hope Scholarships.
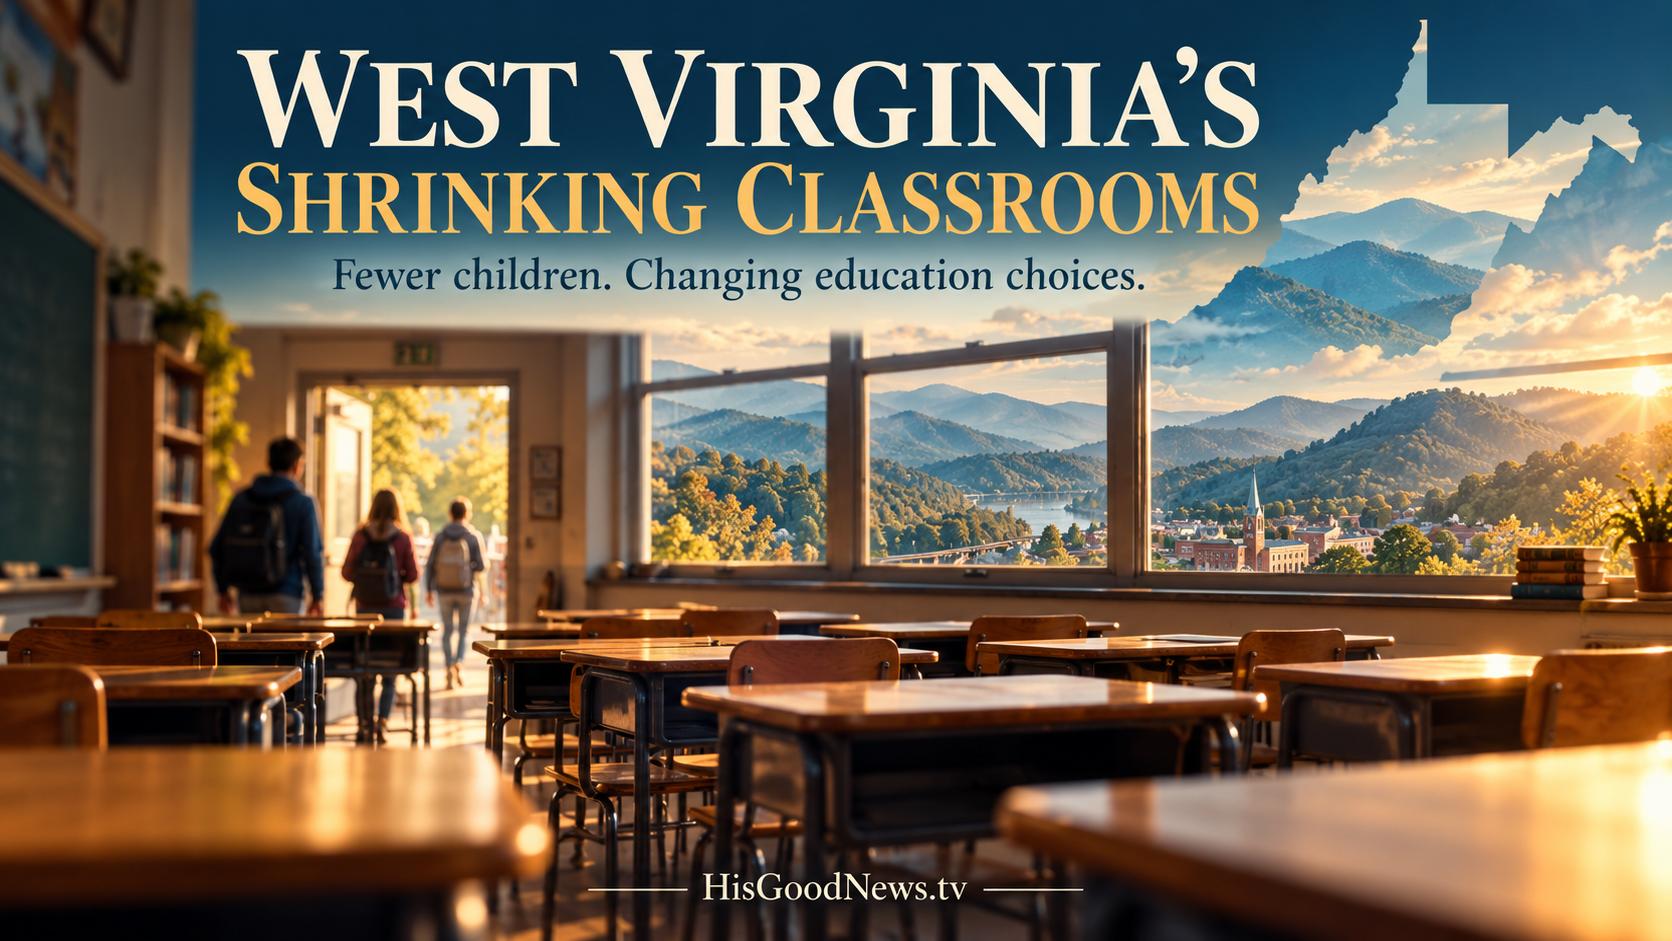
West Virginia's public schools lost another 6,067 students in 2025-26, a sharper drop than the year before and the latest chapter in a decline that began decades before the state launched its Hope Scholarship program.
The state's certified count stood at 234,957 students, including charter schools. That is 47,173 fewer than in 2010-11, a decline of nearly 17 percent. County school systems absorbed an even larger loss over that period: 51,416 students, or about 18 percent. [3] [9]
Those numbers put two questions at the center of the enrollment debate: How much of the decline reflects fewer children living in West Virginia, and how much reflects families choosing a different kind of education?
An analysis of state enrollment records, Census estimates and scholarship reports points to both. The school-age population is shrinking, but public enrollment has recently fallen faster. Hope is a plausible contributor to those additional losses. The published records, however, do not establish exactly how many students would have remained in public schools without it.
Main finding: West Virginia is losing public-school students for more than one reason. Hope Scholarships and other education alternatives may account for some departures, but they cannot account for the older, sustained decline or be assigned the remaining recent losses from the available aggregate data.

County systems and the statewide public total have diverged as charter enrollment has grown. Both continue to decline. [3] [4] [5] [6] [7] [8] [9] [26]
A decline older than the current debate
In the federal historical series examined for this analysis, West Virginia enrolled 409,989 public-school students in fall 1972. By 1992, that number was 318,296. There were interruptions along the way, but the sustained annual decline in that historical run began in 1977. [1]
The 2000s were more stable. In the modern state headcount series, enrollment reached a local peak of 282,309 in 2012-13. It has fallen every year since. Federal and state counts use different reporting definitions, so their totals should not be joined as though they were one continuous measurement. Both show that today's losses have deep roots. [2] [3] [4] [5] [6] [7] [8] [9] [26]
The pace has changed. From fall 2012 through fall 2019, public enrollment fell by an average of about 2,954 students a year. From fall 2022 through fall 2025, the average annual loss was about 5,031. Those comparisons describe the trend; they do not isolate the effect of any one policy.
The latest annual loss, 2.52 percent, was larger than the previous year's 4,023-student decline. But it was smaller than the pandemic-era drop of 9,276 in fall 2020. Losses slowed sharply after that shock before increasing again. Recent enrollment is therefore falling faster than before the pandemic on these multiyear comparisons, without accelerating steadily every single year. [5] [6] [7] [8] [9]

The pandemic produced the largest one-year loss in the modern series. The latest decline exceeded either of the preceding two annual losses. [3] [4] [5] [6] [7] [8] [9] [26]
Fewer children explain a large part of the loss
Census estimates put West Virginia's population aged 5 through 17 at 268,748 in 2021 and 258,608 in 2025, a decline of 3.77 percent. Over the same period, public kindergarten-through-12th-grade enrollment fell 6.58 percent, from 237,852 to 222,198. Preschool pupils are excluded from that comparison. [6] [9] [11]
A simple benchmark makes the difference easier to see. If public K-12 enrollment had fallen at the same rate as the school-age population, the state would have lost about 8,974 students between 2021 and 2025. It actually lost 15,654.
Under that calculation, the shrinking child population corresponds to about 57 percent of the enrollment loss. Roughly 6,680 students, or 43 percent, remain beyond the demographic benchmark. That remainder cannot be labeled the Hope effect: it includes schooling choices, other participation changes and differences between the population and enrollment measures.
The estimate also depends on the years selected. The demographic benchmark accounts for about 47 percent of the loss from 2022 to 2025 and 59 percent from 2020 to 2025. These are accounting comparisons, not causal estimates of a scholarship program's impact. [6] [7] [8] [9] [11]

With both measures set to 100 in 2021, public K-12 enrollment falls faster than the population aged 5-17. [6] [7] [8] [9] [11]
Smaller birth cohorts suggest continued pressure ahead. Census estimates show about 20,465 births during July 2010-July 2011, compared with 17,888 in July 2018-July 2019 and 16,954 in July 2024-July 2025. Those figures span two Census estimate vintages, but the direction is clear. Lower births reach kindergarten roughly five to six years later. [12] [13]
Migration has improved. Estimates show more people moving into West Virginia than leaving in each full annual period from 2021 through 2025. In the most recent period, net migration added 6,652 people, while deaths exceeded births by 7,887. These are all-age figures; they do not tell us how many schoolchildren moved. Population gains among adults can coexist with fewer children in classrooms. [13]
Hope is growing. Its enrollment effect is harder to count.
Final annual reports show Hope Scholarship participation rising from 2,333 students in 2022-23 to 5,443 in 2023-24 and 10,530 in 2024-25. That is a substantial expansion. It is not a count of 10,530 new public-school departures in the last of those years. Renewing students remain in the annual total. [14] [15]
Before universal eligibility, students generally qualified through attendance during the previous public-school year, 45 consecutive calendar days of public attendance, or kindergarten eligibility. Those routes matter, but they do not establish what every recipient would have done without a scholarship. Some kindergarten recipients had never attended public school; a brief qualifying public-school spell does not necessarily represent a lasting commitment to public education. [14] [15]
The 2024-25 report identifies 7,231 recipients in nonpublic schools, 3,263 following individualized instructional plans and 36 without notice-of-intent data on file. Those categories describe where recipients were being educated, not their verified previous schooling. The reports reviewed did not provide a matched student-by-student record of prior enrollment and subsequent destination. [15]
Hope can reduce public enrollment when students leave or when new kindergarten entrants choose an alternative. It can also help pay for education that would have occurred outside public schools anyway. Separating those groups is essential to estimating the program's effect.
Universal eligibility in 2026-27 makes that distinction even more important because existing private-school and homeschool students can qualify. Participation can rise without an equal new decline in public enrollment. This analysis does not estimate the expansion's effect: a certified fall 2026 enrollment count and a completed 2025-26 final Hope annual report were not recovered in the underlying research. [22] [23]

Hope recipients overlap with other schooling categories. The bars should not be added together to estimate the number of children outside public schools. [14] [15] [18] [19]
Charter growth changes the county-school picture
Charter schools enrolled 4,243 students in fall 2025, up from 1,248 in fall 2022. Because charters are public schools, their growth has different implications for county districts and for statewide public enrollment. [7] [9]
In the latest year, county systems lost 6,944 pupils while charters gained 877. Those gains offset about 13 percent of the county-system loss in the statewide public total, leaving a net decline of 6,067. The arithmetic does not prove that all 877 additional charter pupils transferred directly from county schools. [8] [9]
Private-school counts rose from 12,494 in 2022-23 to 14,126 in 2024-25. Traditional homeschool counts fell from 25,883 to 19,621. That decline cannot simply be read as a return to public schools: some families may have moved into a separate Hope instructional-plan category. The available counts do not quantify how much is reclassification. [18] [19] [22]
A statewide decline with different local stories
Fifty-two of the state's 55 county systems enrolled fewer pupils in fall 2025 than in fall 2010. McDowell lost 41.3 percent of its enrollment, Roane 38.3 percent and Boone 36.9 percent. Berkeley grew 11.7 percent, Doddridge 4.4 percent and Monongalia 3.2 percent. [3] [9]
Those long-run losses do not line up neatly with Hope participation. McDowell, which experienced the largest percentage decline, had only six reported Hope recipients in 2024-25. Ohio County had 366, and Kanawha had 1,293, the largest absolute county total. These are different-sized school systems, but the comparison illustrates why one statewide explanation cannot account for every county's experience. [15]
School-age population estimates show growth in Berkeley and Monongalia over the longer period and substantial declines in many rural counties. Yet resident-child counts and school-system enrollment need not move together: attendance across county lines, school choice and differences in the estimates all affect the comparison. [10]

Only three county systems grew between fall 2010 and fall 2025. This chart covers county schools; charter pupils are counted separately. [3] [9]
Hope and alternative schooling do not explain the full decline
West Virginia's public schools are undeniably losing students, and the losses are serious. But the evidence does not support treating Hope Scholarships, charter schools, private schools or homeschooling as the complete explanation. Enrollment was declining for decades before Hope began, and 52 of 55 county systems have lost students since 2010. Fewer school-age children are a major part of the story. [1] [3] [9] [11]
The recent comparison makes the point concrete. Between 2021 and 2025, public K-12 enrollment fell more rapidly than the population aged 5 through 17. Holding the 2021 enrollment-to-population ratio constant, demographic shrinkage corresponds to about 57 percent of the enrollment loss. The other 43 percent is a remainder to investigate, not a measured Hope Scholarship effect. It may reflect several education choices, participation changes and measurement differences. [6] [9] [11]
School choice still matters. A student leaving a county school for private or home education can reduce public enrollment; a student entering a charter changes county enrollment but remains in the statewide public total. Hope participation totals also include renewing recipients and overlap other schooling categories. These figures cannot simply be added together, and they do not reveal what every family would have chosen without the scholarship. [7] [9] [14] [15] [18] [19]
Bottom line: West Virginia faces a broad enrollment problem rooted substantially in demographic change, with school choice potentially intensifying losses in some places. Hope Scholarships and alternative schooling are part of the explanation, but they do not answer all the questions. The available evidence cannot responsibly assign the entire decline, or even the full portion beyond the demographic benchmark, to those programs.
To measure the effect more precisely, the state would need linked, privacy-protected records separating first-time scholarship recipients from renewals and new kindergarten entrants, with verified prior and subsequent schooling. Even observed transfers would not, by themselves, establish what caused them. For planning, both smaller incoming cohorts and changing family choices deserve attention.
About this analysis
This article adapts the accompanying research report and uses evidence assembled through October 23, 2026. The latest certified enrollment count recovered was for 2025-26. County records cover all 55 systems annually from fall 2010 through fall 2025; their totals were reconciled to state releases. Recent demographic comparisons use a consistent Census Vintage 2025 age series. The 57 percent benchmark holds the 2021 enrollment-to-child-population ratio constant; it is not a causal estimate. Chart source numbers correspond to the linked references below.
Sources and original data
Each numbered reference includes a link to its original publication or data. Some older WVDE URLs may no longer resolve; cached extracts were preserved in the original research package.
[1] NCES, State Comparisons of Education Statistics: 1969-70 to 1993-94, Table 10 (printed pp. 32-34). Original source or data
[2] NCES Digest 2023, Table 203.20. Use actual enrollment columns only; projections excluded. Original source or data
[3] WVDE certified headcount 2011-12, comparison table includes 2010-11; printed p. 7. Cached text preserved. Original source or data
[4] WVDE source book 2013, headcount 2012-13, printed p. 93; and 2014-15 headcount, comparison with 2013-14. Cached tables preserved. Original source or data
[5] WVDE certified headcount 2016-17, 2017-18 and 2019-20 comparison tables. Includes 2015-16 and 2018-19. Cached tables preserved. Original source or data
[6] WVDE certified headcount 2021-22, including comparison with 2020-21. Original source or data
[7] WVDE certified headcount 2022-23 and 2023-24; county and charter summaries and categories. Original source or data
[8] WVDE headcount 2024-25, original Excel workbook supplied by finance page. Original source or data
[9] WVDE certified headcount 2025-26, dated November 12, 2025; summary and category tables. Original source or data
[10] Census SAIPE school district population estimates, 2010-2024; countywide WV districts. Annual bulk files archived. Original source or data
[11] Census Population Estimates, Vintage 2025, county single-year age and sex. June 2026 release. Original source or data
[12] Census county totals and components, Vintage 2019; full annual periods 2011-2019. Original source or data
[13] Census county totals and components, Vintage 2025; full annual periods 2021-2025. Original source or data
[14] West Virginia Treasurer, Hope Scholarship 2023-24 Annual Report, pp. 3-9. Original source or data
[15] West Virginia Treasurer, Hope Scholarship 2024-25 Annual Report, printed pp. 4, 6, 8-9. Original source or data
[18] WVDE Education Snapshot booklet: despite cover 2024-25, its table includes 2025-26 public and 2024-25 nonpublic counts. Original source or data
[19] WVDE legislative fiscal note, record 877536819: 2022-23 private and homeschool enrollment estimates. Original source or data
[22] Hope Scholarship official FAQ: universal eligibility in 2026-27, NOI and public-school participation rules. Original source or data
[23] Treasurer parent survey announcement, May 26, 2026: application and continuing-participation counts; annual-report timetable. Original source or data
[26] WVDE 2012-13 headcount and 2017-18 headcount: remaining annual tables recovered from indexed originals. Original source or data
Editor’s note:
And here’s the Good News: Careful public records can help families and school leaders ask better questions about the children they serve. This analysis leaves room for more than one cause and makes clear what the numbers cannot tell us. That care can support honest discussion as communities plan for smaller cohorts and changing family choices. Parents and educators can seek the good of children while remaining willing to examine the evidence. Which local enrollment question could you explore before drawing a conclusion about your community’s schools?

Christopher Knotts
Originally hailing from Kalispell, Montana, Christopher Knotts’ career is marked by his roles as an Administrator at Morgantown Christian Academy and IT consultant and administrator for Faith Baptist Church. With a passion for education, he has dedicated years to teaching such classes as Chemistry and Computer Science. He couples this with his natural love for all things electronic, diving deep into many different technological topics such as AI and VR.